- Home>
- Corporate Profile>
- Investor Relations>
- Financial Information>
- Management Indices
Management Indices
Consolidated
(Million yen)
| 2021/5 |
2022/5 |
2023/5 |
2024/5 |
2025/5 |
|
|---|---|---|---|---|---|
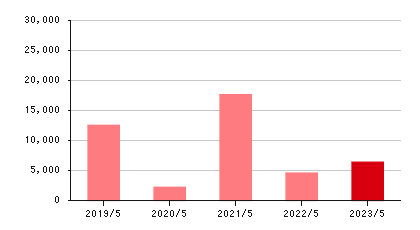
| Cash flows from operating activities | 17,639 | 4,580 | 6,385 | 8,284 | 2,248 |
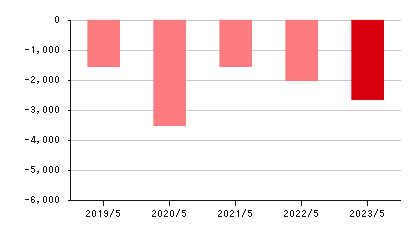
| Cash flows from investing activities | -1,520 | -1,992 | -2,626 | -2,010 | -1,741 |
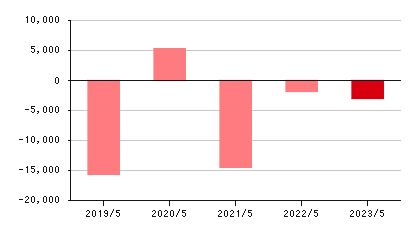
| Cash flows from financing activities | -14,436 | -1,824 | -2,992 | -14,553 | 4,390 |
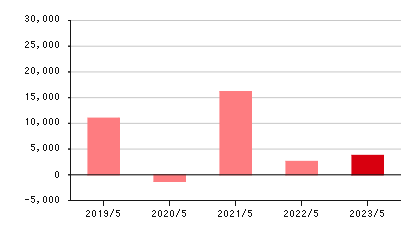
| Free cash flows | 16,119 | 2,588 | 3,759 | 6,274 | 507 |
| Depreciation | 1,682 | 1,615 | 1,993 | 2,289 | 2,487 |
* Free cash flows = Cash flows from operating activities + Cash flows from investing activities


